A number of monitors for the Queue System net illustrate different ways in which server utilization can be measured. Server utilization is the percentage of time during which the server is busy processing jobs during a simulation
Marking_size_Server’Busy_1
This is a Marking Size monitor that measures the number of tokens on the place Busy on page Server. The monitor will calculate timed statistics.
One token on the place Busy represents the server processing a job. If there is no token on the place Busy, then there is one token on the place Idle which represents the server in an idle state.
Server Utilization
This monitor is used to estimate the utilization of the server. The monitor is associated with the two transitions on the page Server.
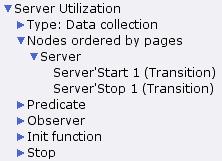
Server utilization monitor
Server utilization can be estimated by dividing the amount of time that the server is busy during a simulation by the amount of time covered by the simulation. This monitor will use a so-called indicator function to estimate server utilization. The observation function will return the value 1 when the server becomes busy, and the value 0 when the server becomes idle.
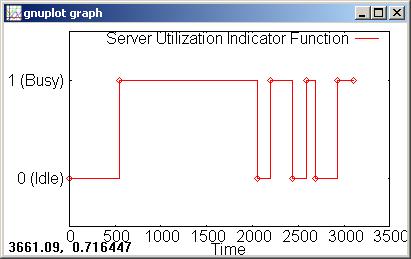
Server utilization indicator function
Timed statistics are calculated for this monitor. At the end of a simulation, the average for this monitor will be equal to the server utilization during the simulation.
Monitoring functions
The predicate function returns true when either the Start or Stop transition on page Server occurs. In other words, it returns true whenever the server changes from being idle to busy, or vice versa.
The initialization function returns the value SOME 0 because the server is idle at the start of a simulation.
The stop function returns NONE, because it is not necessary for calculating server utilization to check whether the server is busy or idle when a simulation ends.
As described above, the observation function returns 1 when the server becomes busy (i.e. when the Start function occurs), and it returns 0 when the server becomes idle (i.e. when the Stop transition occurs).
fun obs (bindelem) =
let
fun obsBindElem (Server’Start (1, {jobs, job,proctime})) = 1
| obsBindElem (Server’Stop (1, {job})) = 0
| obsBindElem _ = ~1in
obsBindElem bindelem
end
Server utilization advanced
This monitor is similar to the Server Utilization monitor. The statistics that are calculated for this monitor will be the same as those for the Server Utilization monitor, but fewer data values may be collected for this monitor
This monitor is associated with the places Queue and Busy and the transitions Start and Stop on the page Server.
When the Stop transition occurs, the server becomes idle. If there is at least one job waiting in the queue, then the server will immediately become busy again, i.e. the Start transition will occur at the same model time. In these situations, the server will be idle for 0 units of time. This monitor ignores these situations.
The figure below shows an example of the differences in the data values that are collected for the Marking_size_Server'Busy_1 monitor, the Server Utilization monitor, and this monitor.
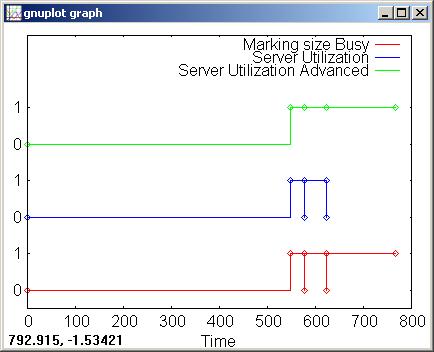
Plotting server utilization
Note that most of the statistics for these three monitors will always be the same. The only statistic that may differ is the last time value (lasttime is one of the data collector functions). The time of the last update for the Server Utilization monitor will often be less than the time of the last update for the two other monitors because the stop function for that monitor returns the value NONE, whereas the stop function for the two others returns values of the form SOME x.
At the end of a simulation, the average for each of the three of these monitors will be equal to the server utilization during the simulation.
Total processing time
This generic data collector monitor is used to estimate the amount of time that the server is busy processing jobs during a simulation. The monitor is associated with the Start transition on the page Server.
The monitor calculates untimed statistics.
The initialization and stop functions both return the value NONE. The predicate function returns true each time the Start transition occurs.
The observation function examines the binding of the variables when the Start transition occurs. The variable proctime is bound to an integer value and it represents the amount of time that the server will spend processing the job that is bound to the variable job. Each time the Start transition occurs, the observation function will return the processing time as a real.
fun obs (bindelem) =
let
fun obsBindElem (Server’Start (1, {jobs, job, proctime})) =
Real.fromInt proctime
| obsBindElem _ = ~1.0
in
obsBindElem bindelem
end
When a simulation stops, the sum for this data collector will be an estimate of the amount of time the server was busy.
If the simulation stops when the server is busy and the Stop transition is not enabled, then the sum for this monitor will be greater than the actual amount of time that the server was busy during the simulation. This is due to the fact that the server has not yet completed processing a job, i.e. there is some processing time remaining for the job, however the total processing time for the job would be included in the sum for this monitor. In the example below, the simulation stopped at time 272. The time stamp for the token on the place Busy is 409. This means that the remaining processing time for the job being processed is 409-272=137. For this simulation these 137 time units are included in the sum for this monitor, thus making the sum an inaccurate estimate of the actual amount of time the server was busy processing jobs during the simulation.
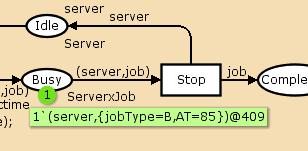
Remaining processing time
If the simulation stops when either the server is idle, or the Stop transition is enabled, then the sum for this monitor will be the exact amount of time that the server was busy during a simulation.
Server utilization estimate by ProcTime
This generic data collector monitor is used to estimate the server utilization, and it uses the sum calculated by the Total Processing Time monitor. The monitor is associated with a single transition.
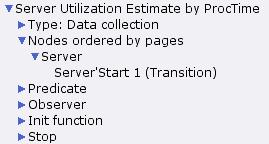
Server utilization estimate by processing time
The monitor will not collect any data before or during a simulation. Only the stop function will be used to collect data, and the stop function will not examine any part of the net. The monitor is associated with a single transition to reduce the number of times that the predicate function will be invoked. If monitor were not associated with any transitions, then the predicate function would be invoked after every step in a simulation, and this is unnecessary.
The observation function will never be invoked, but it must be syntactically correct, therefore it is defined so that it would return -1.0.
The stop function returns an estimate of server utilization for the simulation. The function accesses the sum of the Total Processing Time monitor (sum is one of the data collector functions) and divides the estimate of the total processing time by the current model time (which is equal to the amount of time that passed during the simulation because the simulation started at model time 0).
fun stop () =
SOME (Total_Processing_Time.sum() / Real.fromInt(intTime()))
This monitor can only calculate an estimate of server utilization because the sum of the Total Processing Time monitor is only an estimate of the total processing time (see above for details). In some situations, this monitor will return the correct value for server utilization during a simulation.
Server utilization by ProcTime
This data collector monitor is similar to the Server Utilization Estimate by ProcTime monitor. However, this monitor will calculate the proper value for server utilization during a simulation.
The monitor is associated with one place and one transition, and it calculates untimed statistics.
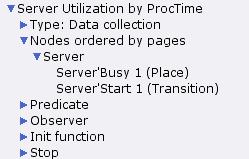
Server utilization by processing time}
The stop function for the monitor examines the marking of the place Busy.
fun stop ([(s,job)@timestamp]) =
let
val curtime = Real.fromInt (intTime())
val proctimeleft = Real.fromInt((IntInf.toInt timestamp)- intTime())
in
SOME ((Total_Processing_Time.sum()-proctimeleft)/curtime)
end| stop (Server’Busy_1_mark : ServerxJob tms) =
SOME (Total_Processing_Time.sum() / Real.fromInt (intTime()))
The first line of the stop function uses pattern matching to match a marking in which there is only one timed token on the place Busy. Markings are represented as lists which is why the expression is enclosed in square brackets ([]). The value of the token will be bound to the variables in the pattern (s,job), and the time stamp of the token will be bound to the variable timestamp.
The fourth line of the stop function calculates how much processing time remains for the job that is currently being processed. This is done by subtracting the current model time from the time stamp of the token. This will never result in a negative number, because a token will always be removed from the place Busy when its time stamp is equal to current model time. For the example discussed above, the remaining processing time for the job would be 137 (=409-272).
The sixth line of the function calculates the server utilization by subtracting the remaining processing time from the total processing time (Total_Processing_Time.sum()) and then dividing this value by the interval of time covered by the simulation.
The next to last line of the stop function matches all other markings of the place Busy, i.e. all markings that consist of more or less than one token. Note that in this net there will never be more than one token on the place. In these cases, the server utilization is calculated in the same way as for the Server Utilization Estimate by ProcTime monitor.
Related pages
Queue System, Queue System Queue Delay, Queue System Queue Length, Queue System Miscellaneous Monitors
You must be logged in to post a comment.