The net overview of a particular net contains an overview of the monitors that are defined for the net. Each entry under the Monitors index entry is either a monitor or a block of monitors. Blocks of monitors are used to divide monitors in to groups, and are similar to declaration blocks.
In the figure below the BREAKPOINTS entry is a monitor block, while the OneHundred_QueueDelays entry is a monitor (in this case one of the breakpoint monitors).

Monitor Index Entries
To change the name of a monitor block, edit the text of the name of the monitor block.
Monitor entries
Some information is associated with each monitor. To view the information about a monitor, click the blue triangle next to the monitor to open/close the monitor entry.

Open a monitor
The following kinds of information are associated with monitors:
- Name
- Type
- Nodes ordered by pages
- Monitoring functions
All monitors have a name, type, and overview of nodes associated with the monitor. Some monitors have monitoring functions that are accessible, i.e. that are shown in the index, other monitors do not have monitoring functions that are shown in the index.
Name
The first line of a monitor, i.e. the line next to the blue triangle, is the name of the monitor. Names of monitors can be changed by editing the text of the name.
The names of monitors must fulfill certain requirements. These requirements are described under Naming policy.
Type
The first entry under the name of a monitor indicates the Type of the monitor. There are several different kinds of Monitors.
Some types of monitors have options that can be changed. If there is a blue triangle next to the Type entry for a monitor, then the monitor has options, otherwise the monitor does not have any options. For example, generic breakpoint monitors do not have any options.

Monitor without options
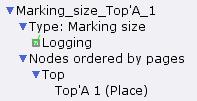
But marking size monitors have an option to indicate whether the data that is collected during a simulation should be saved in a data collector log file.

Options for marking size monitor
Nodes ordered by pages
Each monitor is associated with a number of nodes, i.e. places and/or transitions, in the net. The Nodes ordered by pages entry provides an overview of the places and transitions that are associated with the monitor.
If there is no blue triangle next to the Nodes ordered by pages entry, then the monitor is not associated with any places or transitions, i.e. the monitor cannot examine any markings or occurring binding elements during a simulation.

Monitor with no associated nodes
If there is a blue triangle next to the Nodes entry, then unfolding the entry will reveal the names of the pages that contain the nodes that are associated with the monitor. In the example below, the pages named Arrivals and Server contain nodes that are associated with the monitor

Pages with monitored nodes
Click on the blue triangle next to the page names to reveal the nodes from that page that are associated with the monitor. In this example, three nodes are associated with the monitor: one place and two transitions.

Nodes associated with a monitor
Monitoring functions
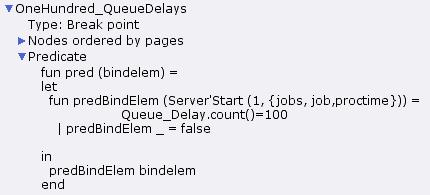
For some kinds of monitors, some of the monitoring functions are accessible for the user. For these monitors, the monitoring functions are accessible in the index. For example, for generic breakpoint monitors the predicate function is accessible.

Accessible monitoring functions
The monitoring functions can be viewed and modified in the index after they have been opened.

Expanded monitor function
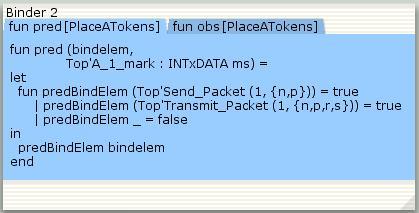
Monitoring functions can also be viewed and modified by dragging them to binders.

Monitor functions in binder
Any monitoring functions that are accessible in the index can be modified by the user. To modify a monitoring function, edit the text of the function.

You must be logged in to post a comment.